Despite the UK imminently awarding Long Duration Energy Storage [LDES] contracts at roughly four times the volumes of Italy’s MACSE round 1, anticipation is low. This overlooks supply chain and revenue consequences which could impact all UK BESS.
LDES defined
‘Shorter than a cricket match’ is not everyone’s definition of Long Duration. ‘The time between UK energy policy announcements and their delivery’ probably is. However we do not use duration: we define LDES by its purchasing mechanism – the salient parameter for project investors. The UK’s LDES scheme covers projects >8 hours, whereas Ireland and Italy settled at >4 hours. The technologies are generally familiar but deployed under new contracting models and configurations. LDES is typically just a more infra-aligned incarnation of batteries: long asset lives, significant capex, bankable contracts and inflation adjustments.
UK Cap and Floor
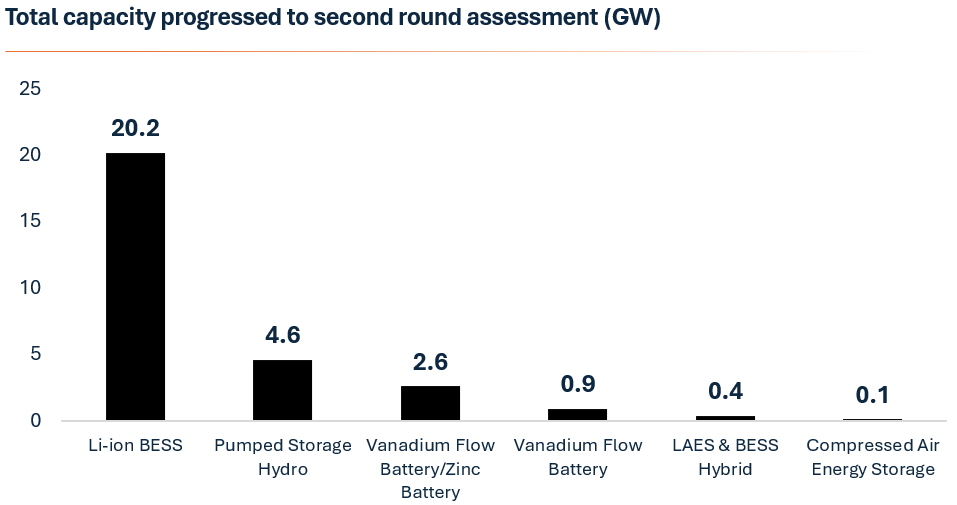
The biggest live scheme is now the UK (40 GWh vs MACSE 10 GWh). The British government intends to purchase 2.7-7.7 GW of LDES (minimum 8 hours), coming online in 2030, typically with 25 year cap-and-floor contracts. These will be selected from nearly 30 GW of pre-screened projects (implyin. Ofgem aims to honour ‘technology-neutral’, and ‘diversity of technologies’, but the fact is that only Li-ion gets reliably built in this time, so Li-ion dominates the shortlist: 70% of capacity.
Startling context
Work the maths on this, and the capex is startling. A volumetric mid point of Ofgem’s target is 5 GW: at least 40 GWh at 8 hrs. If each MW costs £1.5m at 8 hours (£190k/MWh), then mid-case volumes imply at least £7.5bn of investment. This spending is concentrated in three years: 2027-29. That is £2.5bn p.a – an astonishing sum, with serious implications. For context, Opus estimates this exceeds the UK’s total annual grid scale BESS investment in 2023, or even 2024.
Project Finance
Project Finance will fund a higher share of capital costs for LDES, rendering it significantly less equity intensive than shorter duration BESS, but the point stands: this is a material opportunity for grid infrastructure investors, and a material demand on UK supply chains.
Timings
Ofgem’s initial decisions on selected projects are due in April, with final awards due in “summer”. Few fortunes are made by betting on UK regulatory timetables being met, but we anticipate imminent activity as successful bidders rush to deliver £2.5bn pa of investment (financing, supply chain, EPC) to get projects online before 2030 and ahead of 3 year transformer delivery times.
Returns and Risk
These LDES contracts could excite a UK battery market historically reliant on merchant revenues. If we see floor equity returns above 6%, capital will flow. As a result, says Chris Matson at LCP Delta, “many BESS developers expanded projects that would have otherwise been 2 or 4 hours to meet the 8-hour threshold.”
But we’ve been here before, with simplistic expectations confounded by competition. The risk is of MACSE-type black swan outcomes. This could relate to the synergistic upstream to generation projects, the residual value of grid connections, deferred liabilities or another matter. Any might cause projects to be bid below standalone economic thresholds. Of course, these are far-fetched, but so was October’s MACSE outcome. So we are not yet ready to assume it’s a gold rush for equity investors, and are mindful that floor returns could prove disappointingly low.
Impacts
Typically with a gold rush, the money is made selling ‘picks and shovels’, and this scale of investment may strain supply chains, impacting availability, cost and timelines from project financiers, transformer OEMs, BoP contractors, EPCs, ICPs and DNO TPWs [third party works]. Current 3 year lead times for transformers will ensure many capital formation transactions are accelerated into 2027.
Worse, this large 40 GWh LDES deployment rush coincides with the imminent surge in shorter duration BESS deployment from TMO-4 Gate 2 delayed short-duration BESS assets. This is a potent cocktail for market tightness, cost pressures, and heightened execution risks. Some regions, notably Scotland which has a high concentration of LDES, may see concentrated local effects. There is general confidence the supply chain can handle this demand, but it’s a challenge.
BESS returns
Even assuming zero delivery and capex impacts, LDES will impact BESS returns. Zenobe argues that “by allowing subsidised LDES assets to compete directly with unsubsidised BESS in markets like balancing, response and capacity, the [LDES] policy could distort pricing and bidding behaviour, reducing the competitiveness of battery storage”. This is not wrong. 40 GWh of LDES assets will need to compete in the same arbitrage and ancillary revenue stacks, potentially depressing returns. LCP estimate LDES awards will knock 200 bps from BESS returns, creating a five year UK BESS investment hiatus from 2030. Other consultants see greater separation in the markets in which they compete, concluding the impact will be half that, but it will materialise.
Who wins?
These concerns are not endemic to LDES, they are a bug in British implementation. We can’t yet know how attractive UK cap and floor contracts will prove. Nor do we know which projects will be awarded, but the published shortlist reveals the charge is being led by NatPower (9.5 GW across 10 projects), DIF’s Field (1.6 GW across 5 projects), and Innova (1.6 GW across 4 projects). Contract wins could exceed current funding capability: so anticipate asset M&A as well as equity rounds following the final awards.
If the second round of LDES moves beyond 8 hours, we may see
A European phenomenon
Like BESS and syncons, the LDES opportunity too should spill out across Europe, and implementation there may be smoother. Italy used MACSE to deliver LDES. Ireland has started too (200 MW of 4 hour duration), and others will follow, for three reasons:
Just now, LDES may be as oddly British as treating emergencies with a cup of tea, but some form will become common across Europe soon: decarbonisation goals require it. The current form is merely a first step on this path. In forms longer than 8 hours, we may see real competition emerge to gas, perhaps through other molecular forms of storage. So don’t pre-judge the evolution of LDES based on current results.
Conclusions
Imminent UK LDES contract awards in the next 4-12 weeks will concentrate minds on LDES’ rewards, but also the risks. The scale of implied investment in the UK is being overlooked: it dwarfs recent UK BESS investment. It may pose a significant opportunity for winners, and for the BESS supply chain, but it brings risks, for LDES winners and for planned Gate 2 projects: 1) to timelines, 2) to their actual capex costs and achieved returns, 3) to broader project finance availability, and 4) to post 2030 revenues. It is currently a form of contracting Li-ion and pumped storage, but this may change as durations extend.
Stay tuned.
So this fresh reminder of the folly of fossil fuels will bring mixed impacts. Their severity will depend on duration: how long oil / gas prices are elevated by the conflict (which may not correlate with the conflict’s own duration).
In the second of our articles examining investment consequences of high renewables penetration, we highlight synchronous condensers, which are transitioning from obscure spelling challenge to emergent infrastructure asset class.
As grid system strength erodes and TSOs hit balance sheet and capex limits, the question is not whether syncons are needed – it is who will fund them.
Spell it out
Synchronous condensers, a form of compensator (also called synchronous compensators), are like large idling electrical motors: like a car in a neutral gear, the engine spins, but does not generate power. Instead it acts as a buffer, ready to deliver stacked services historically provided by large thermal generation units, which decentralised inverter-based equipment cannot replicate at scale. They excel at three stability services, around frequency, current or voltage:
Essentially syncons as a long-established, simple but obscure primary tool to maintain grid stability as thermal plant is displaced by renewables.
There are multiple competing technologies to buy “stability”, but they are not equivalent. Statcoms can only deliver reactive power (but do this well). Thermal units are expensive and carbon intensive. The truest competition is BESS paired with grid-forming inverters (GFI) which can deliver all three services, but the volumetric outputs for SCL and reactive power are like comparing a birthday candle (GFI) with a blowtorch (syncon): they have different use cases.
The UK’s Stability Pathfinder outcomes are telling: in Phase 1, all 12 inertia contracts went to synchronous condensers, and in Phase 3, syncons won all 29 contracts for physical inertia and short circuit resilience. Across all rounds, 90% of all 56 contracts were won by syncons.
Private capital is the answer
These are infrastructure: high upfront capex, long asset life, essential service, contracted or regulated cashflows, and meaningful barriers to entry. For infrastructure funds, the appeal is obvious: low volume risk, zero technology risk, good contract durations and capital recovery, strong contractual counterparties, essential services and long technical lives (30–40 years is typical for well‑maintained machines). Further, they offer an uncorrelated risk.
Currently most European syncons are owned by TSOs but this model may change for the build out of future assets, due to:
Market data already point to syncons transitioning from a UK curiosity to an emerging European asset class as renewables penetration continues. Germany last month initiated the outsourced purchasing of stability services. One recent forecast values the European synchronous condenser market rising 6% pa towards a US$500m market by 2030.
Risks to our thesis
But like its warm ales, the UK contracting model may not be welcomed overseas. Possible reasons include:
Conclusion
The lesson of the Iberian blackout is that TSOs need to be more proactive in developing grid resilience. For investors and IPPs, the punchline is simple: syncons will sit alongside BESS as a distinct, contracted grid stability product in ever more markets.
A number of syncon investment opportunities will reach investors in the coming year. Their uncorrelated contracted revenues help rebalance the ever increasing merchant exposure in renewable portfolios, or accompany contracted BESS platforms. Valuing these is straightforward, but a strong advisory suite is critical to accurately pricing the merchant tail on these assets. The locational dynamics are fundamental to value, and an informed advisor knows these before commercial DD costs are incurred. This is where Opus’ syncon expertise and experience is of value in optimising competitive but prudent bids.

In a word, 2026 will witness “shakeout”. Inputs have stabilised, but outcomes will diverge. In countless verticals – VPPs, IPPs, CPOs, AMPs, optimisers, developers – the dust is settling and victors are emerging. The excess capacity littering energy transition verticals should fall away as customers, capital and opportunity coalesce around the strong. This is good: pricing will stabilise, costs will fall, talent will congregate, execution will improve, and capital will secure better returns. In this article, we note six quiet but consequential tides shaping these emerging winners in 2026. None is AI (yet).
1. Channel beats innovation
2. Continuing consolidation
3. Neutral data layers
4. Transition fuel revival
5. Silent exits crisis
6. IPP 2.0 action
1. Channel beats innovation
The second climate tech boom repeated the cleantech 1.0’s error of idolising technology. Radical innovation has been all but irrelevant to Europe’s energy transition – it is almost entirely about optimising older technologies (photovoltaics, lithium-ion cells, wind turbines, electric motors). With slowing demand growth forecasts, the maximisation of channel or customers becomes key to revenue growth, forcing silo structures to break down: C&I (commercial & industrial) suppliers expanded from solar to batteries, to charging, to flexibility, to orchestration, boosted by the rollout of dynamic tariffs. Energy suppliers expanded to installations, services, software and financing. These channel owners may ultimately break down the barriers between electrons and joules too. The most admired companies – Octopus, Hometree, Zenobe – command channels, not patents.
2. Continuing consolidation
The conventional response to slowing demand is consolidation: trimming overhead against a larger revenue base to accelerate breakeven. Verticals with disappointing growth and weak unit economics – EV charging, BTM solar, resi installation, energy supply – will consolidate, spurred by sponsors building exit-ready platforms on their winners.
3. Neutral data layers
European hardware companies had embraced digitisation and software development, to ‘own’ their customers. Many succeeded, locking customers in to outdated proprietary software. Now customers are responding. We note a growing preference for data-neutral layers and vendor-independent platforms: portability and interoperability are now valued. This commoditisation of software again reinforces Point 1: channel and customer relationships drive more competitive advantage than most IP.
4. Transition fuel revival
Intermittency creates a premium for reliability. Not long ago, the only transition fuel was gas, but now geothermal, marine and other sources of predictable – but less economic – supply, may see enhanced investment interest to capture this ‘baseload premium’. Increased investment flows may signal this revived interest. But interest is distinct from viability, and we repeat Point 1 [channel beats innovation]: geothermal’s LCOE remains 2–3× higher than solar/wind ($40–140/MWh vs. $27–70/MWh), and marine is 3–10× more expensive. Deployment of both is glacial.
5. Silent exits crisis
Private capital has a silent exits crisis[1] and our industries are not immune. Infrastructure funds have run cashflow-negative to LPs since 2022. Renewable energy M&A deal value collapsed 41% in the first nine months of 2025. Countless headline IPP exits never materialised. The ‘cyclical slow down’ is looking increasingly structural. Without sharply lower interest rates, accessing liquidity for reinvestment will become increasingly urgent as funds mature in the face of weak public market appetite and finite continuation options.
6. IPP 2.0 action
Our hypothesis on IPP evolution is ever more mainstream (aka NextGen IPP). Fundamentally this IPP 2.0 concept continues the same argument as that regarding channel ownership: the next generation of IPPs must own customers, break down technology silos, etc. However theories and action are distinct. In 2026, the inflection from discussion to deployment finally arrives: with mounting trinity technology portfolios, country exits, and mergers marrying IPPs with different generation technologies to synthesize green baseload power.
Conclusions
Away from breathless AI boosterism, these diverse tides may have more immediate impact. They will gently float winners to the surface. We will re-examine some in future articles, and address the remaining growth hotspots like heat networks, European BESS, interim power and grid expansions. Along the way, we will all be solving problems: regulatory delays, bolt-on acquisition targets, software integrations, international expansions, sourcing deeper-pocketed sponsors. This is where Opus excels.
So 2026’s overriding energy transition theme will be “shakeout”. That does not set pulses racing – but it should: falling risks and emerging winners are fertile territory.
We invite you to challenge our ideas by engaging with us at https://opuscf.com/contact-us/
[1] Private equity globally holds $3.7 trillion in unrealized value at end-2025: this is the highest backlog on record. It will take 8 years to clear at current exit velocity.
Solar and wind cannibalisation manifest a strategic miscalculation at the heart of IPP portfolio construction. This article explains why typical IPP portfolio construction compromises value creation, the three actions IPP leaders and owners can deploy to reverse this, and the consequences for service and technology suppliers.
The default IPP 1.0 strategy, of scaling one technology across many geographies, solves yesterday’s problem: the political risk which curtailed solar’s first deployment cycle. It diversifies market risk but it concentrates cannibalisation risk. Regrettably, cannibalisation is now the greater threat.
Cannibals at the door
Solar provides a stark illustration. Accelerating European solar installation is exacerbating the systematic depression of midday electricity prices, then spread by interconnected transmission grids. The resulting transition of duck curves to canyon curves has become a staple of board discourse and risk management committees. Germany’s solar capture rate has declined rapidly from 98% three years ago to 54% ytd; Spain is already this low[1]. Even last year, Germany experienced negative pricing in 5% of all hours (456 hours).
Figure 1: Solar eats itself
We must not flinch from this critical insight: single-technology portfolios amplify rather than diversify cannibalisation risk. A pure-play solar IPP with assets across Spain, Germany, and Italy experiences synchronized merchant revenue destruction during high-irradiation periods, with negligible hedging capability. The same holds true for wind.
Figure 2: Accelerating cannibals

The financial impact is severe. In 2024, fair value PPA prices for Spanish solar collapsed 80% year-on-year to €15.59/MWh, and German solar fell 47% to €42.34/MWh, reflecting intensifying oversupply dynamics and an evaporating green premium.
This is not temporary cyclical oversupply: high renewables penetration drives structural price cannibalisation. Cannibalisation has opened a Pandora’s Box which is already curtailing asset values.
For infrastructure funds stewarding multi-billion euro renewables portfolios, the implications demand strategic recalibration. The path forward requires an immediate pivot to revalue IPP output: towards integrated, firm green power delivery through diversified technology platforms concentrated in select markets. To thrive, the IPP 2.0 strategy revamp must swap ‘one technology, many markets’ for ‘many technologies, few markets’.
The Corporate Customer Evolution
Simultaneous with cannibalisation, the displacement of subsidies by market demand is forcing the renewables industry, for the first time, to attract customers. Customers want cheap, reliable energy. Unfortunately, contracted solar is neither cheaper (than the spot wholesale prices) nor reliable. As a result, we are seeing some troubling (but mixed) evidence that the CPPA [corporate PPA] market is contracting. Pexapark reports German solar CPPA volumes fell a remarkable 84% in H1 2025, to just 228 MW[1]. Solar’s alternative is to compete on price in subsidy rounds. But these increasingly punish negative pricing events, and subsidies are limited: the troubling implication is many RTB projects may be valueless.
Figure 3: CPPAs recede fast

To avoid competing on price alone, to attract corporate buyers, and to progress these stranded assets, IPPs need to offer the ‘firm green power’ that customers demand and standalone renewables cannot deliver: economic renewable energy with baseload reliability, matching consumption patterns.
BESS is not the answer
To date, BESS has been the industry’s default response. BESS is a requirement, but it is not the solution. Multi-hour BESS can never remedy the monthly or seasonal weather patterns that firm green power contracts must address. This requires a third non-correlated energy source (or more). These ‘Trinity’ portfolios may combine solar’s daytime peak with wind’s evening and winter generation, and storage systems sized for extended discharge periods. Trinity portfolios can transition their offering from commodified electrons to a premium service (24/7 CFP – Carbon Free Power).
Yet the stark reality is that, as currently configured, almost every European IPP is wholly incapable of offering this, as they are overweight in dual technologies. So a choice now confronts their boards: sell commodified electrons for portfolio aggregators to monetise at mark-up, or reconfigure your portfolio to capture this reliability premium.
‘Trinity Technology’ diversification reduces output correlation, thereby smoothing revenue volatility across seasonal and weather patterns. In a co-located form, the shared infrastructure (grid connections, substations, operations centres) can reportedly deliver capital efficiency gains of 10-15% compared to standalone developments. But most critically, integrated portfolios facilitate firm power product offerings accessing premium pricing and longer contract tenures from corporate offtakers.
The optimal IPP 2.0 portfolio will balance geographic concentration (to capture operational synergies, customer access and market expertise) with technology diversification (to reduce correlation risk and enable firmer products). This favours deep market positions in 3-5 countries over broad exposure across 7+ markets. This is not easy, and the model has potential weaknesses, but it is unquestionably superior to the negligible returns from selling standalone solar electrons to unwilling corporates or saturated spot markets.
Biting the bullet on portfolio churn
This remedial rebalancing demands extensive portfolio turnover, to recycle equity from non-core countries and overweight technologies, into acquiring expertise and assets in the previously excluded technologies. This is a long road, but single-technology portfolios otherwise face value erosion in an oversupplied and obsolete market, while geographically concentrated multi-technology portfolios will command premium valuations.
The Trinity Transformation
To deliver a concentrated portfolio exploiting the uncorrelated output of Trinity technologies (e.g. solar, wind, storage), the evidence points toward three decisive actions for European renewable IPPs and their infrastructure fund owners:
1. Portfolio Audit and Rebalancing: Systematically evaluate existing assets for cannibalisation exposure, contract coverage, and firming potential. Prioritize divestment of correlated or isolated assets with capital redeployed to technology diversification unlocking firming capabilities.
2. Geographic Consolidation: Concentrate market presence to enable portfolio scale and risk management, better project interconnection and customer relationship development. Develop 3-5 core European markets where the regulatory frameworks, and robust CPPA demand support integrated renewable development. Exit other countries to recycle equity.
3. Firm Power Product Development: Invest in commercial capabilities to structure and deliver firm green power products combining solar, wind, and storage assets. This requires enhanced customer development, forecasting, trading, and risk management capabilities beyond traditional project development expertise, alongside firm grid capacity contracts.
In effect, solar IPPs may acquire merchant BESS and exchange their fringe country solar for core country wind. Wind IPPs will be counterparts to these transactions, but may also merge with solar IPPs. Our connectivity can deliver these off-market transactions.
This will reshape technology providers too. Fragmentated asset management services cannot support trinity portfolios or hybrid PPAs. Asset Performance Managers [APMs] must accelerate acquisitions in adjacent technologies.
This window for strategic repositioning is open – but not indefinitely. As cannibalisation impacts intensify (approximately doubling every year), IPPs delivering firmer green power products should secure market premia and access to capital. Obsolete single-technology, merchant-exposed strategies will face capital flight and margin compression.
Conclusion
In all mature markets, the renewable energy revolution is moving beyond capacity deployment to commercial sophistication. The IPP 1.0 model solves yesterday’s problem, but its dysfunction is to concentrate cannibalisation risk. It is now time to acknowledge this, to adapt and to act. Failure to do so, may jeopardise sponsor’s ability to exit their investments in future.
This requires Opus to change too. We have experience transacting across all technologies, but we now require all staff to develop knowledge in hybridised offtake and colocation strategies so we can support clients in delivering Trinity Transformations, and capitalising on the opportunity this shift presents. We have reconfigured to support you.
[1] https://modoenergy.com/research/germany-2025-solar-cannibalisation-glut-subsidies-power-prices-bess, 19 Aug 2025
[2] https://pexapark.com/blog/unpacking-the-h1-2025-decline-4-1-key-trends/